Overall Analysis
Bitcoin made a new all-time high, going above the $75,000 mark. Rally seems to be strong ahead of the election results.
Ethereum finally broke its descending channel and shot up by nearly +7.5%. The price on a daily timeframe is still in a tight zone.
Bitcoin Chart Analysis
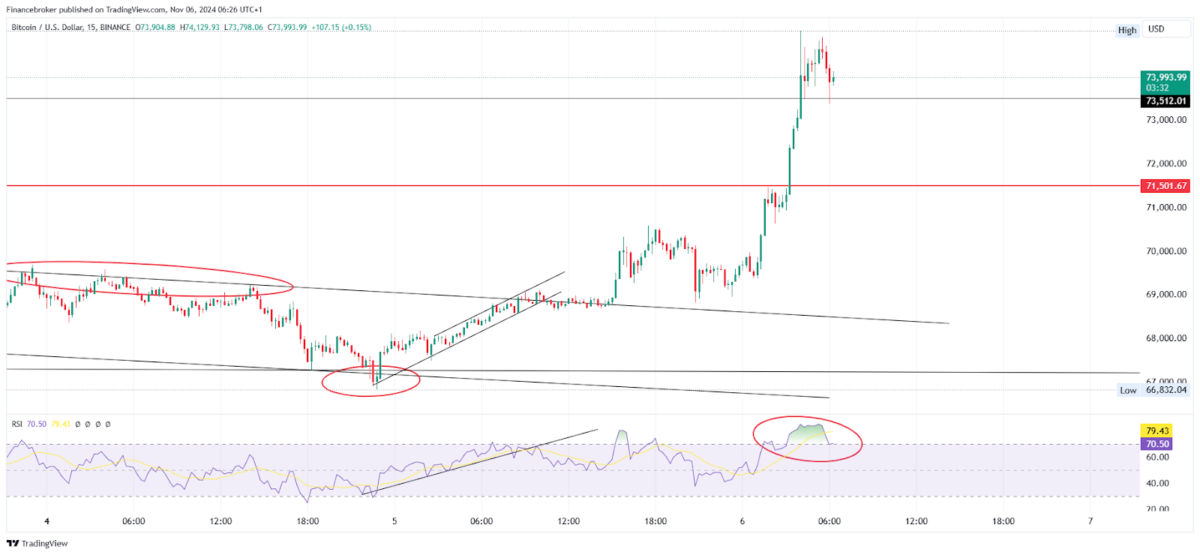
BTC/USD 15-Minute Chart (Source: TradingView)
On the 5th Nov 2024 trading session, Bitcoin went up by +4%, the price went up by creating a strong price action and strength for the rally, breaking the descending channel and showing a bull run.
If we look at the price in a 1-hour time frame, then we can clearly see that the price went up continuously without making any swing or halt candle. Price on the 1-hour time frame went up continuously in four green candles, breaking the all-time high in a flow. This could be due to elections in the US.
Currently, looking at the price in a 15-minute time frame, we can see the price broke the $73,512 all-time high and is now taking a halt above it. Currently, on the 6th Nov trading session, the price shot up quickly without taking sufficient halt, taking RSI into the overbought scenario. This entire flow, considered news news-based rally, will correct sharply as it lacks price action.
Traders looking for an entry trigger at this point will need to understand that any positions made in the current market due to FOMO will be high-risk and highly rewarding.
Here are a few entry triggers:
One must let the RSI come under the 60 level before making any buy-side position.
If one wants to enter due to news, then one can enter if the price comes to retest $73512 level, with a stop loss of around $72,500 and a target based on trailing.
Please note due to the current election, there is high volatility in the market; plan accordingly.
Ethereum Chart Analysis
ETH/USD 15-Minute Chart (Source: TradingView)
On the 5th Nov 2024 trading session, Ethereum continued its rally towards the upside. The price moved in a channel facing rejection from the resistance trendline. Eventually, hovering around the resistance and breaking it.
Looking at Ethereum on an hourly time frame, the price can be seen breaking a strong channel pattern, which has been holding the price in a downtrend since 1st november. Price gave a breakout on 6th Nov trading session price went straight up by +7.5% near the rejection area.
In a 15-minute time frame, the price hovered around the resistance trendline on 5th Nov and faced rejection from the $2,474 level, finally breaking it on 6th Nov with a sharp rally towards the upside. $2,585 acts as a strong resistance zone. RSI is in an overbought scenario, making it difficult to sustain above the level without any swing or halt.
If talking about entry triggers, then it’s suggested to plan entry after election results to avoid volatility. Below are a few entry triggers.
If the price sustains above $2,575 and the RSI is under 60, then entry can be planned based on the breakout with a stop loss below the previous swing low and targets on a trailing basis.
If the price hovers below the $2,575 level and gives a break, entry can be made with a stop loss above $2,610 and target till $2,476.
Please note due to the current election, there is high volatility in the market; plan accordingly.
The post Bitcoin & Ethereum Rally: Will Gains Hold Amid US Election? appeared first on FinanceBrokerage.

